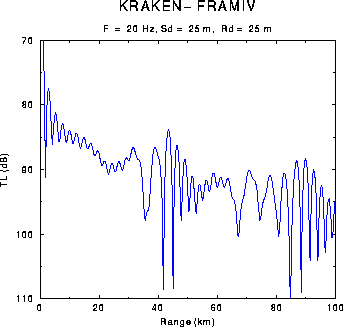
Figure: Sample output of PLOTTLR: transmission loss vs. range for the Arctic problem.
PLOTTLR sums the modes to produces plots of coherent transmission loss versus range.
Files:

        Name           Unit         Description
Input
        *.PLP            1       PLot Parameters
        *.MOD         30-99      MODe files
Output
        *.PRT            6       PRinT file

---------------------------------------------------------

EXAMPLE AND DESCRIPTION OF PLP FILE:

'RAN'                       ! OPT (cart, cylin or scaled coords)
999                         ! M (number of modes to include)
1, 0.0                      ! NPROF  RPROF(1:NPROF) (km)
25.0  25.0                  ! SD  RD (m)
0.0   100.0  501 10.0 10.0  !  RMIN  RMAX  NR  RINC (km)  RAXL (cm)
70.0  110.0      10.0  6.0  ! TLMIN TLMAX     TLINC (dB) TLAXL (cm)
0.0                         ! 3dB smoothing window (m)


(1) - OPTIONS

      Syntax:
         OPTION
      Description:
         OPTION(1:1): Source type.
                      'R' point source.
                          (cylindrical or R-Z coordinates)
                      'X' line source.
                          (cartesian   or X-Z coordinates)
         OPTION(2:2): Selects coupled mode or adiabatic mode theory
                      'C' for Coupled   mode theory.
                      'A' for Adiabatic mode theory (default).

          For a coupled mode run you ***must*** be sure that the
          modes are finely sampled throughout the water column
          so that FIELD can accurately
          calculate the coupling integrals. This is done by using
          a large number of receiver depths (NRD) when you
          do the KRAKEN run. This number should be set to
          give about 10 points/wavelength.

         OPTION(3:3): Component
                      ''  (null) for pressure.
                      'H' for Horizontal displacement.
                      'V' for Vertical   displacement.
                      'T' for Tangential stress.
                      'N' for Normal     stress.


(2) - NUMBER OF MODES

      Syntax:
         M
      Description:
         M: Number of modes to use in the field computation.
            If this number is larger than the actual number of
            modes in the mode file it is reduced accordingly.


(3) - PROFILE RANGES

      Syntax:
         NPROF  RPROF(1:NPROF)
      Description:
         NPROF:   The number of profiles, i.e. ranges where a new
                  set of modes is to be used.
         RPROF(): Ranges (km) of each of these profiles.
                  For a range independent problem there is only
                  one profile and its range is arbitrary.  Mode
                  files must exist for each range of a new
                  profile and be assigned in sequence to units
                  30,31,... The modes for the last SSP profile
                  are extended in a range-independent fashion to
                  infinity so that RMAX can exceed RPROF(NPROF).


(4) - SOURCE/RECEIVER DEPTHS

      Syntax:
         SD  RD
      Description:
         SD: Source   depth (m).
         RD: Receiver depth (m).


(5) - RECEIVER RANGES/AXIS INFO

      Syntax:
         RMIN  RMAX  NR  RINC  RAXL
      Description:
         RMIN: First receiver range          (km).
         RD:   Last  receiver range          (km).
         NR:   Number of receiver ranges.
         RINC: Range interval for tick marks (km).
         RAXL: Range axis length             (cm).


(6) - TRANSMISSION LOSS AXIS INFO

      Syntax:
         TLMIN  TLMAX  TLINC  TLAXL
      Description:
         TLMIN:    TL minimum                 (dB).
         TLMAX:    TL maximum                 (dB).
         TLINC:    TL interval for tick marks (dB).
         TLAXL:    TL axis length             (cm).

      If you set TLMIN=TLMAX then the curve is autoscaled.


(7) - SMOOTHING WINDOW

      Syntax:
         DR3DB
      Description:
         DR3DB: Three dB smoothing window (m).
                The tranmission loss is computed then smoothed in
                range using a Gaussian filter. DR3DB gives the
                range interval over which the smoothing is
                performed.

Figure: Sample output of PLOTTLR: transmission loss vs. range for the
Arctic problem.