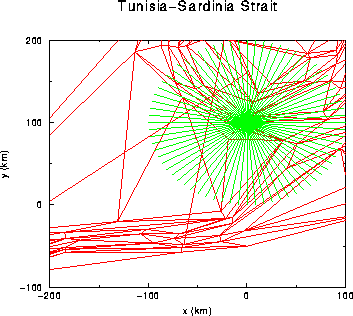
Figure: Sample output of PLOTTRI: triangulation used for a 3D Mediterranean scenario.
PLOTTRI takes an input file '.FLP' in the same format that FIELD3D uses, and produces a plot showing the layout of triangular patches which the user has specified.
Files:

        Name           Unit         Description
Input
        *.PLP            1       PLot Parameters
        *.FLP           20       FieLd Parameters
Output
        *.PRT            6       PRinT file

---------------------------------------------------------

EXAMPLE AND DESCRIPTION OF PLP FILE:

-200.0  100.0  0.0  10.0 /     ! XMIN  XMAX  XINC (km)  XAXL (cm)
-100.0  200.0  0.0  10.0 /     ! YMIN  YMAX  YINC (km)  YAXL (cm)

(1) - X-AXIS INFO

      Syntax:
         XMIN  XMAX  XINC  XAXL
      Description:
         YMIN: The minimum Y-value        (km).
         YMIN: The maximum Y-value        (km).
         YINC: Y-interval for tick marks  (km).
         YAXL: Y-axis length              (cm).


(2) - Y-AXIS INFO

      Syntax:
         YMIN  YMAX  YINC  YAXL
      Description:
         YMIN: The minimum Y-value        (km).
         YMIN: The maximum Y-value        (km).
         YINC: Y-interval for tick marks  (km).
         YAXL: Y-axis length              (cm).

Figure: Sample output of PLOTTRI: triangulation used for a 3D
Mediterranean scenario.