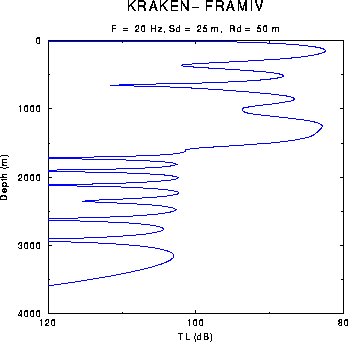
Figure: Sample output of PLOTTLD: transmission loss vs. depth for the Arctic problem.
PLOTTLD produces plots of coherent transmission loss versus depth. The user must provide a mode file as computed by KRAKEN .
Files:

        Name           Unit         Description
Input
        *.PLP            1       PLot Parameters
        *.MOD           30       MODe file
Output
        *.PRT            6       PRinT file

---------------------------------------------------------

EXAMPLE AND DESCRIPTION OF PLP FILE:

'R'                          ! OPT (X or R for cart or cyl coords)
999                          ! M   (number of modes to include)
25.0                         ! SD (m)
50.0                         ! Receiver range (km)
501  0.0  3750.0 /           ! NRCVRS  RD(1:NRCVRS) (m)
  0.0 4000.0 1000.0 10.0     !  ZMIN   ZMAX   ZINC  (m)   ZAXL (cm)
 70.0  110.0   10.0 10.0     ! TLMIN  TLMAX  TLINC (dB)  TLAXL (cm)


(1) - OPTIONS

      Syntax:
         OPTION
      Description:
         OPTION(1:1): Source type.
                      'R' for a point source
                      (cylindrical or R-Z coordinates).
                      'X' for a line source
                      (cartesian   or X-Z coordinates)
         OPTION(2:2): Dummy variable for consistency with PLOTTLR.
         OPTION(3:3): Component.
                      ''  (null) for pressure.
                      'H' for Horizontal displacement.
                      'V' for Vertical   displacement.
                      'T' for Tangential stress.
                      'N' for Normal     stress.


(2) NUMBER OF MODES

      Syntax:
         M
      Description:
         M: Number of modes to use in the field calculation.
            If this number is larger than the actual number of
            modes in the mode file it is reduced accordingly.

(3) - SOURCE/RECEIVER LOCATIONS

      Syntax:
         SD
         RR
         NRD  RD(1:NRD)
      Description:
         SD: Source depth   (m ).
         RR: Receiver range (km).
         NRD:     Number of receivers.
         RD():    Receiver depths (m).
                  The format of the source/rcvr depth info is an
                  integer indicating the number of receivers
                  followed by real numbers indicating the range
                  of each receiver.  Since this data is read in
                  using list-directed I/O you can type it just
                  about any way you want, e.g. on one line or
                  split onto several lines.  Also if your depths
                  are equally spaced that you can type just the
                  first and last depths followed by a '/' and the
                  intermediate depths will be generated
                  automatically.


(6) - Z AXIS INFO

      Syntax:
         ZMIN  ZMAX  ZINC  ZAXL
      Description:
         ZMIN:    Z minimum                 (m ).
         ZMAX:    Z maximum                 (m ).
         ZINC:    Z interval for tick marks (m ).
         ZAXL:    Z axis length             (cm).


(7) - TRANSMISSION LOSS AXIS INFO

      Syntax:
         TLMIN  TLMAX  TLINC  TLAXL
      Description:
         TLMIN:    TL minimum                 (dB).
         TLMAX:    TL maximum                 (dB).
         TLINC:    TL interval for tick marks (dB).
         TLAXL:    TL axis length             (cm).

      If you set TLMIN=TLMAX then the curve is autoscaled.

Figure: Sample output of PLOTTLD: transmission loss vs. depth for the
Arctic problem.