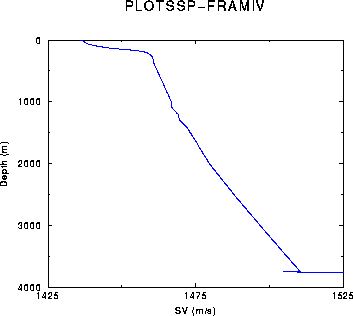
Figure: Sample output of PLOTSSP: the sound speed profile for the Arctic problem.
PLOTSSP produces plots of the sound speed profile. It requires as input an environmental file of exactly the same form used by KRAKEN . It ouputs a print file echoing the input data. The number of points used in plotting the sound speed profile is 200 per medium.
Files:

        Name           Unit         Description
Input
        *.ENV            1       ENVironmental data
        *.PLP            3       PLot Parameters
Output
        *.PRT            6       PRinT file

---------------------------------------------------------

EXAMPLE AND DESCRIPTION OF PLP FILE:

1425.0  1525.0    25.0  10.0   ! CMIN  CMAX  CINC (m/s)  CAXL (cm)
   0.0  4000.0  1000.0  10.0   ! ZMIN  ZMAX  ZINC (m)    ZAXL (cm)


(1) - SOUND SPEED AXIS INFO

      Syntax:
         CMIN  CMAX  CINC  CAXL
      Description:
         CMIN:  Sound speed minimum                 (m/s).
         CMAX:  Sound speed maximum                 (m/s).
         CINC:  Sound speed interval for tick marks (m/s).
         CAXL:  Sound speed axis length             (cm ).


(2) - DEPTH AXIS INFO

      Syntax:
         ZMIN  ZMAX  ZINC  ZAXL
      Description:
         ZMIN:  Depth minimum                 (m ).
         ZMAX:  Depth maximum                 (m ).
         ZINC:  Depth interval for tick marks (m ).
         ZAXL:  Depth axis length             (cm).

Figure: Sample output of PLOTSSP: the sound speed profile for the Arctic problem.