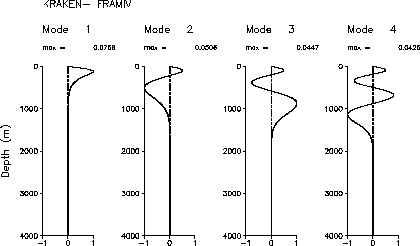
Figure: Sample output of PLOTMODE: selected modes for the Arctic problem.
PLOTMODE produces plots of specified modes using a solid line for the real part and and dashed line for the imaginary part. It requires the usual KRAKEN output files containing the modes and an additional file containing a list of which modes to plot terminated by a zero.
Note that the modes are tabulated only at the source and receiver depths specified during the KRAKEN run. Thus, if you specify only one source and receiver depth in the KRAKEN run, the mode plots will be grossly undersampled.
Before plotting each mode the maximum absolute value of the (complex) eigenfunction is calculated, that is,
T = max ( abs( Z(z) )
where Z(z) denotes the eigenfunction and the maximum is calculated over the depth points in the plot window. The eigenfunctions are then scaled by this factor and plotted along with the value of T. As a result, purely real eigenfunctions will peak at 1 on the plot; complex eigenfunctions may have a peak in their real or imaginary parts which is less than 1.
Files:

        Name           Unit         Description
Input
        *.PLP            5       PLot Parameters
        *.MOD           30       MODe file
Output
        *.PRT            6       PRinT file

---------------------------------------------------------

EXAMPLE AND DESCRIPTION OF PLP FILE:

'P'
0.0 5000.0 1000.0 15.0    ! ZMIN  ZMAX  ZINC  ZAXL
1
2
3
4
0


(1) - COMPONENT

      Syntax:
         COMP
      Description:
         COMP: Selects which component of a mode is plotted.
                'V' Vertical   displacement
                'H' Horizontal displacement
                'T' Tangential stress
                'N' Normal     stress
                'P' Pressure (gives same result as 'N')

(2) - DEPTH AXIS INFO

      Syntax:
         ZMIN  ZMAX  ZINC  ZAXL
      Description:
         ZMIN:    Z minimum                 (m ).
         ZMAX:    Z maximum                 (m ).
         ZINC:    Z interval for tick marks (m ).
         ZAXL:    Z axis length             (cm).

Figure: Sample output of PLOTMODE: selected modes for the Arctic problem.