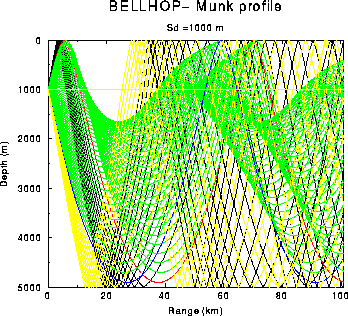
Figure: Sample output of PLOTRAY: ray trace for the Munk profile
PLOTRAY produces plots of the rays generated by BELLHOP and contained in a file 'P1'.RAY.
Files:

        Name           Unit         Description
Input
        *.PLP            1       PLot Parameters
        *.RAY            9       RAY   file

---------------------------------------------------------

EXAMPLE AND DESCRIPTION OF PLP FILE:

0.0  2500.0    500.0   5.0/        ! ZMIN  ZMAX  ZINC (m)   ZAXL (cm)
0.0    75.0     25.0  10.0/        ! RMIN  RMAX  RINC (km)  RAXL (cm)
'RED' 'GREEN' 'YELLOW' 'YELLOW'
'DASH' 'DOT' 'SOLID' 'SOLID'

(1) - DEPTH AXIS INFO

      Syntax:
         ZMIN  ZMAX  ZINC  ZAXL
      Description:
         ZMIN:  Depth minimum                 (m/s).
         ZMAX:  Depth maximum                 (m/s).
         ZINC:  Depth interval for tick marks (m/s).
         ZAXL:  Depth axis length             (cm ).


(2) - RANGE AXIS INFO

      Syntax:
         RMIN  RMAX  RINC  RAXL
      Description:
         RMIN:  Range minimum                 (km).
         RMAX:  Range maximum                 (km).
         RINC:  Range interval for tick marks (km).
         RAXL:  Range axis length             (cm).

(3) - RAY COLORS

      Syntax:
         COLR  COLS  COLB  COLSB
      Description:
         COLR:  Color for paths which are purely Refracted.
         COLS:  Color for paths which strike the Surface only.
         COLB:  Color for paths which strike the Bottom  only.
         COLSB: Color for paths which strike both Surface and Bottom.

         Choose from 'BLACK', 'WHITE', 'RED', 'GREEN', 'CYAN',
         'MAGENTA', 'YELLOW'.
         (default is 'BLACK' for all rays)

(4) - RAY PATTERNS

      Syntax:
         PATR  PATS  PATB  PATSB
      Description:
         PATR:  Pattern for paths which are purely Refracted.
         PATS:  Pattern for paths which strike the Surface only.
         PATB:  Pattern for paths which strike the Bottom  only.
         PATSB: Pattern for paths which strike both Surface and Bottom.

         Choose from 'SOLID', 'DASH', 'DOT'.
         (default is 'SOLID' for all rays)

Figure: Sample output of PLOTRAY: ray trace for the Munk profile