PLOTGRN uses the modes to produces plots of the amplitude of the Green's function, G(k) corresponding to a particular source/receiver combination. The Green's function is plotted as a function of horizontal wavenumber, k.
Files:

        Name           Unit         Description
Input
        *.PLP            1       PLot Parameters
        *.MOD           30       MODe file
Output
        *.PRT            6       PRinT file

---------------------------------------------------------

EXAMPLE AND DESCRIPTION OF PLP FILE:

 25.0  25.0,                           ! SD  RD (m)
 2000  2.5E-6,                         ! NKPTS ATTEN (attenuation)
 0.083    0.090  0.001 15.0            ! KMIN, KMAX, KINC, KAXL (cm)
 0.0   2400.0  600.0    9.0            ! GMIN, GMAX, GINC, GAXL (cm)


(1) - SOURCE/RECEIVER DEPTHS

      Syntax:
         SD  RD
      Description:
         SD: Source   depth (m).
         RD: Receiver depth (m).


(2) - SAMPLING INFORMATION

      Syntax:
         NKPTS
         ALPHA
      Description:
         NKPTS: Number of points in k-space for evaluating
                the kernel.
         ALPHA:  Stabilizing attenuation (1/m).

      Since G(k) has singularities on the real k-axis, it is
      evaluated on a slice displaced into the complex plane a
      distance i ALPHA.


(3) - AXIS INFO

      Syntax:
         KMIN  KMAX  KINC  KAXL
         GMIN  GMAX  GINC  GAXL
      Description:
         KMIN:  k-minimum                 (1/m).
         KMAX:  k-maximum                 (1/m).
         KINC:  k-interval for tick marks (1/m).
         KAXL:  k-axis length             ( cm).
         GMIN:  G-minimum.
         GMAX:  G-maximum.
         GINC:  G-interval for tick marks.
         GAXL:  G-axis length             ( cm).

      If GMAX is set to zero, the program will automatically
      compute a value.
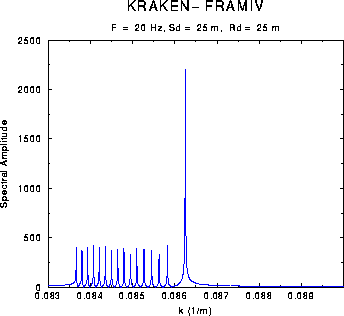
Figure: Sample output of PLOTGRN: the Green's function for the
Arctic problem.