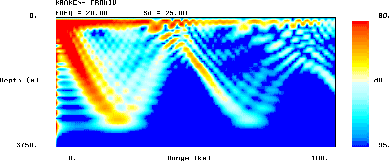
Figure: Sample output of PLOTFIELD: transmission loss for the Arctic problem.
PLOTFIELD produces either rectangular or polar plots of shade files. The former are used for range-depth plots of transmission loss (slices in a vertical plane) and the latter for range-range plots of transmission loss (slices of in a horizontal plane).
Files:

        Name           Unit         Description
Input
        *.PLP            1       PLot Parameters
Output
        *.SHD          11-99     SHaDe file

---------------------------------------------------------

EXAMPLE AND DESCRIPTION OF PLP FILE:

'RD'                    ! 'S' SCALE, 'L' OR 'D' LINEAR OR DB
'CA'                    ! POLAR OR CARTESIAN ('PO', 'CA')
'VUGC'                  ! DEVICE ('PRX', 'TEK', 'TEK', 'T41')
0                       ! Segment number (0 for none)
0.0                     ! SMOOTHING WINDOW (m)
1                       ! NPLOTS
'SCR:DEEPB'  100.0      ! SOURCE DEPTH
0.0  50.0  0.0  5000.0  ! RMINPL  RMAXPL (km)  ZMIN  ZMAX (m)
 66.0 102.0 4.0         ! TLmin  TLmax (dB)

(1) - SCALING

      Syntax:
         OPT
      Description:
         OPT(1:1): Source type.
                      'R' No scaling applied.
                      'S' Field multiplied by sqrt(r).
         OPT(2:2): Linear or dB
                      'L' Linear scale (useful for pulse plots).
                      'D' dB     scale (for most other plots).


(2) - COORDINATE SYSTEM:

      Syntax:
         COORD
      Description:
         COORD(1:2): Source type.
                      'CA' Cartesian.
                      'PO' Polar.
         COORD(3:3): Grid plotting.
                      'G' Grid.
                      ' ' No grid.


(3) - OUTPUT DEVICE:

      Syntax:
         DEVICE
      Description:
         DEVICE(1:3): Device type.
                      'VUG' Vugraph machine.
                      'TEK' Tektronix 4691    hardcopy device.
                      'THE' Tektronix 4693    hardcopy device.
                      'VUG' Tektronix VUGRAPH hardcopy device.
                      'T41' Tektronix 41xx terminal.
                      'VTT' DEC VT340      terminal.
                      'MGP' VAXstation 2000.
                      'X11' X-windows device.
                      'PSP' PostScript printer.
         DEVICE(4:4): Color or black and white
                      'C' Color
                      'B' Black and white
         DEVICE(5:5): Smooth (linear interp.) or blocky shading.
                      'S' Smooth.
                      'B' Blocky.
         DEVICE(6:6): Final copy.
                      'F' Final
                      ' ' Standard labels
                      This option labels the plots (a), (b), (c)
                      and strips out certain other information to
                      make the plot suitable for a final report.


(4) - SEGMENT NUMBER:

      Syntax:
         SEGNUM
      Description:
         SEGNUM: If you specify a nonzero segment number, then
                 the file will be added into the default segment
                 file. (See UNIRAS documentation for info on
                 segment files).


(5) - SMOOTHING WINDOW

      Syntax:
         DR3DB
      Description:
         DR3DB: Three dB smoothing window (m).  The tranmission
                loss is computed then smoothed in range using a
                Gaussian filter. DR3DB gives the range interval
                over which the smoothing is performed.


(6) - NUMBER OF PLOTS

      Syntax:
         NPLOTS
      Description:
         NPLOTS: You can do 1,2 or 3 plots per page as indicated
                 by NPLOTS.

(7) - PLOT DATA:

      Syntax:
         FILNAM  SD
         RMIN  RMAX  RINC  RAXL TITLER
         ZMIN  ZMAX  ZINC  ZAXL TITLEZ
         TLMIN TLMAX TLINC
      Description:
         FILNAM: Name of the shade file.
                 The file name is provided without the
                 extension which is assumed to be '.SHD'.
         SD:     Source depth.
         RMIN:   Minimum range                  (km ).
         RMAX:   Maximum range                  (km ).
         RINC:   Range interval for tick marks  (m/s).
         RAXL:   Range axis length              (cm ).
         TITLER: Axis title (in quotes)

         ZMIN:   Minimum depth                  (m).
         ZMAX:   Maximum depth                  (m).
         ZINC:   Depth interval for tick marks  (m/s).
         ZAXL:   Depth axis length              (cm).
         TITLEZ: Axis title (in quotes)

         TLMIN:  Minimum transmission loss      (dB).
         TLMAX:  Maximum transmission loss      (dB).
         TLINC:  Increment in transmission loss (dB).
         TITLE: Axis title (in quotes)

      This information should be repeated for ISRC = 1, NSRCS


      For a polar plot the form is:

      Syntax:
         FILNAM  SD
         XMIN  XMAX  XINC  XAXL
         YMIN  YMAX  YINC  YAXL
         TLMIN TLMAX TLINC

      where XMIN, XMAX, YMIN, YMAX, specify the x and y limits of
      the plot in kilometers.

Figure: Sample output of PLOTFIELD: transmission loss for the Arctic problem.