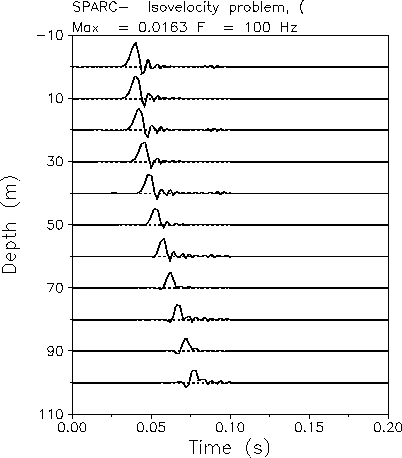
Figure: Sample output of PLOTTS: an isovelocity problem.
PLOTTS PLOTs the Time Series used in or created by a SPARC .
If there is a single receiver depth, the horizontal axis is time and the vertical axis is amplitude.
If there is more than one receiver depth the each receiver time series is shifted vertically in accordance with the receiver depth.
Files:

        Name           Unit         Description
Input
        *.PLP            1       PLot Parameters
        *.?TS           10       Source/Receiver Time Series
Output
        *.PRT            6       PRinT file
        *.GRN           20       GReen's function
        *.RTS           35       Receiver Time Series

---------------------------------------------------------

EXAMPLE AND DESCRIPTION OF PLP FILE:

 5.0  0.0  5000.0  'PH+N'       ! FREQ  FMIN  FMAX  PULSE
 0.0  1.5  0.5 /                ! TMIN  TMAX  TINC (s)  TAXL (cm)
-1.0  1.0  1.0 /                ! YMIN  YMAX  YINC (m)  YAXL (cm)

(1) - FREQUENCY SPECTRUM / PULSE INFORMATION:

      Syntax:
         FREQ  FMIN  FMAX  PULSE
      Description:
         FREQ:       Characteristic frequency (Hz).
                     This is only used for those canned signals
                     defined by a characteristic frequency.
         FMIN:       Low  cut frequency       (Hz)
         FMAX:       High cut frequency       (Hz).
         PULSE(1:1): Signal type
                     'P' Pseudo-Gaussian
                     'R' Ricker wavelet
                     'A' Approximate Ricker wavelet
                     'S' Single sine
                     'H' Hanning weighted four sine
                     'N' N-wave
                     'G' Gaussian
                     'F' From an '.STS' (Source Time Series) file.
                     'B' From an '.STS' file Backwards
         PULSE(2:2): Hilbert transforming.  This is used to eliminate
                     the left travelling wave.
                     'H' perform a Hilbert transform of the signal
                     'N' don't
         PULSE(3:3): Signal sign flipping.
                     '+' don't flip it
                     '-' flip it
         PULSE(4:4): signal filtering.
                     'L' low cut filter
                     'H' high cut filter
                     'B' both high and low cut filter
                     'N' no cut


(2) - TIME AXIS INFO

      Syntax:
         TMIN  TMAX  TINC  TAXL
      Description:
         TMIN: First time                   (s ).
         TMAX: Last  time                   (s ).
         TINC: Time interval for tick marks (s ).
         TAXL: Time axis length             (cm).


(3) - VERTICAL AXIS INFO

      Syntax:
         YMIN  YMAX  YINC  YAXL
      Description:
         YMIN:    Y minimum                 (m ).
         YMAX:    Y maximum                 (m ).
         YINC:    Y interval for tick marks (m ).
         YAXL:    Y axis length             (cm).

         If there is only one time series to plot
         then YMIN, YMAX should normally be -1, 1.
         If there are multiple time series corresponding
         to different depths or ranges then YMIN, YMAX
         should normally be the max and min depths or ranges.

Figure: Sample output of PLOTTS: an isovelocity problem.