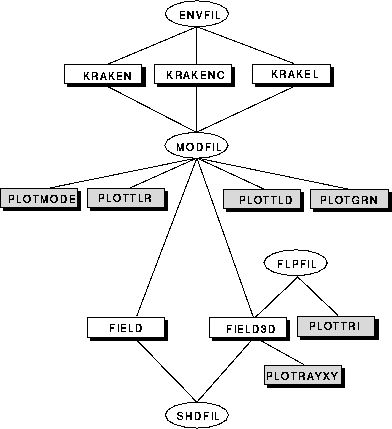
Figure: Structure of the KRAKEN model.
A schematic of the KRAKEN program structure is shown in Fig. 4.2. At the first level we see that KRAKEN actually consists of three different models KRAKEN , KRAKENC and KRAKEL . KRAKENC and KRAKEL are for more sophisticated users with special requirements. The differences are discussed in more detail in the KRAKEN.HLP file below.
A transmission loss calculation involves a two-step process running in sequence 1) KRAKEN to calculate the modes and 2) PLOTTLR or PLOTTLD to sum up the modes and plot TL versus range or depth. In addition, PLOTMODE can be run to look at the individual modes and PLOTGRN can be used to calculate a Green's function.
Producing a grey shade or color plot of transmission loss involves a three-step process running in sequence 1) KRAKEN to calculate the modes and 2) FIELD to sum the modes and calculate the pressure field, and 3) PLOTFIELD to plot the results.
Three-dimensional calculations follow a similar sequence but using FIELD3D instead of FIELD to sum the modes. As discussed in Chap. 2, 3-D calculations use a triangular patchwork over the ocean bottom that is defined in an input field-parameter file (FLPFIL). PLOTTRI is used to plot the triangular patchwork. Besides the 3-D pressure fields, FIELD3D also produces output describing the horizontal refraction which can be plotted using PLOTRAYXY.

Figure: Structure of the KRAKEN
model.
Detailed information on how to run KRAKEN is contained in a sequence of help files included with the source code. These help files are reproduced below. Note that all the plot programs require a few lines providing axis information (minimum, maximum, interval for tick marks and axis lengths). This information can be read from a file however it is generally convenient to place the data directly in the command file used to execute the program. Command files for the VAX (with the extension `.COM') are provided with the program.