As with all of the range-dependent 2-D models, a direct extension to 3-D problems is possible by simply running the 2-D models repeatedly along a number of different bearings. Along each bearing one then uses the sound speed profile and bathymetry for that track. Combining these results along numerous bearings allows one to build-up a three-dimensional image of the acoustic field.
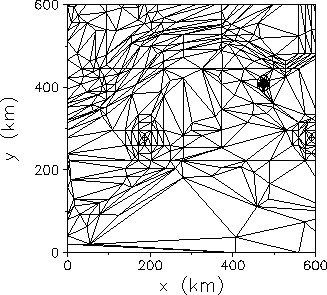
As in the 2-D problem it is convenient to calculate the mode sets on a coarse grid and calculate intermediate values by interpolation. As an example, we consider a scenario in the North Atlantic which encompasses a segment of the Gulf Stream. The environment is sampled at a number of different points in the xy-plane and modes are calculated at each of these points. The nodes are then used to construct a triangulation of the environment as shown in Fig. 2.16. The position of the Gulf stream, two eddies that have spun-off from it, and other features of the environment are echoed in the triangulation.
The nodes of the triangles may be arbitrarily located; however, we have found it convenient to distribute them along isobaths. This enables extremely complicated bottom profiles to be treated without the burden of computing sets of modes at many different nodes--- modes computed at one point on an isobath are unchanged (assuming no sound speed change) in going to other points on the isobath. Regular grids are also suitable: they are easier to set-up but may require more nodal points to produce an acceptable sampling of the environment.
Once the modes are calculated and stored, 3-D acoustic images can be
computed extremely rapidly by using the adiabatic formula in
Eq. (![]() ) along a fan of radials emanating from the
source. Where the adiabatic formula requires modes in a triangle,
they are computed by bilinear interpolation. (A more complete discussion is
given in Ref. [17].)
) along a fan of radials emanating from the
source. Where the adiabatic formula requires modes in a triangle,
they are computed by bilinear interpolation. (A more complete discussion is
given in Ref. [17].)
An example of this type of calculation is given in Fig. 2.17 where we
have plotted transmission loss in the xy-plane at a constant
receiver depth of  . The source depth and frequency for
this calculation are
  and
and  . Note how the Gulf
stream casts an acoustic shadow behind it. (In fact, the energy is
really just redirected to other depths.) The eddies in turn produce
visible perturbations in the transmission loss field.

Figure: Triangulation for the Gulf Stream problem.

Figure: Transmission loss for the Gulf Stream problem.